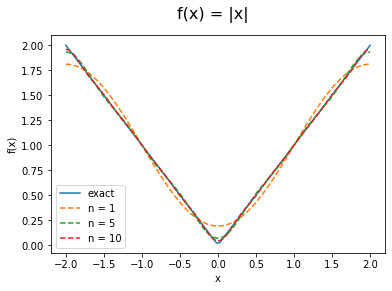
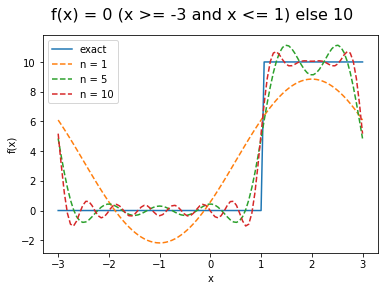
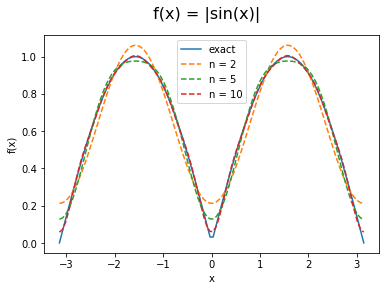
表題の通り。
本日のゴール「ある定められた区間における周期関数\( f(x) \)のフーリエ級数展開の係数計算と近似解の図示」
図がこんな感じ。

今回参考にした本など
・高校数学でわかるフーリエ変換―フーリエ級数からラプラス変換まで (ブルーバックス) (link)
・物理のための数学 (物理入門コース 新装版) (link)
具体的な導出とか背景は全部理工系図書に譲るとして、計算(処理)内容は以下の通り。
$$f(x) \approx a_0 + \sum_{k = 1}^{n} (a_n \cos{\frac{n\pi x}{L}} + b_n \sin{\frac{n\pi x}{L}}) \\ $$
$$ a_0 = \frac{1}{2L} \int_{-L}^{L} f(x) $$
$$ a_n = \frac{1}{L} \int_{-L}^{L} f(x) \cos{\frac{n\pi x}{L}} dx $$
$$ b_n = \frac{1}{L} \int_{-L}^{L} f(x) \sin{\frac{n\pi x}{L}} dx $$
これらの計算を関数化したものが以下のコード。
def fourier_expansion(fun,L,n):
    """
    fun:a periodic function
    L:an interval
    n:the number of harmonics
    """
    #tol = 1e-6
    x = np.linspace(-a,a,100)


    a0 = 1/L/2 * integrate.quad(fun,-L,L)[0]
    an = 1/L * np.array([integrate.quad(lambda x:fun(x)*cos(i*x*pi/L),-L,L)[0] for i in np.arange(n)+1])
    bn = 1/L * np.array([integrate.quad(lambda x:fun(x)*sin(i*x*pi/L),-L,L)[0] for i in np.arange(n)+1])
    approx = a0 + np.array([an[i]*cos(pi*j*x/L) + bn[i]*sin(pi*j*x/L) for i,j in enumerate(np.arange(n)+1)]).sum(axis = 0)

    """
    c0 = 1/L/2 * integrate.quad(fun,-a,a)[0]

    cn = np.array([1/(L)*(integrate.quad(lambda x:fun(x)*cos(i*x*pi/L),-L,L)[0] - 1j* \
                            integrate.quad(lambda x:fun(x)*sin(i*x*pi/L),-L,L)[0]) \
                   for i in np.arange(n)+1 ])
    approx = c0 + np.array([cn[i]*np.exp(1j*pi*j*x/L) for i,j in enumerate(np.arange(n)+1) ]).sum(axis = 0)
    """
    return approx,[an,bn]
関数def fourier_expansion(fun, L, n)について
第一引数:フーリエ級数展開したい周期関数\(f(x) \),
第二引数:区間半長 \( L \),
第三引数:高調波次数\( n \), \( n \)次まで展開する。
\( c_n = a_n + jb_n (jは虚数)\)を用いた複素フーリエ級数展開もコメントアウト部分に載せている。
関数内の計算により得られた計算結果をもとに
第一返り値:\( f(x) \)の近似解
第二返り値:各係数\( a_n, b_n \) (\( c_n \))
を返す。
区間の刻み幅は2L/(100-1)となっている(適当)
作成した関数をもとに\( f(x) \)とその近似解のグラフをプロットする関数を作業効率化のために作った
def plot_fourier(fun,a,n):
    """
    fun: the vectorized function
    a(float): the interval length
    n(list): the list of the required harmonics number, e.g. [1,5,10].
    """
    x = np.linspace(-a,a,100)
    fig,ax = plt.subplots()
    ax.plot(x,fun(x),label = 'exact')
    approx,cn = np.array([fourier_expansion(fun,a,i) for i in n]).T
    [ax.plot(x,j,'--', label = f'n = {n[i]}') for i,j in enumerate(approx)]
    [ax.set_xlabel('x'),ax.set_ylabel('f(x)')]
    ax.legend()
    return fig,ax
いくつかの周期2Lの周期関数について本記事で作成したコードを用いてプロットした結果を以下に並べる。
1. \[ f(x) = \begin{cases} 0 & (-3 \le x \le 1) \\ 10 & (1 \le x \le 3) \end{cases} \]f = lambda x:0 if (x >= -3 and x <= 1) else 10 # else 1 if x >= 0 and x < 1
f = np.vectorize(f)
a = 3
n = [1,5,10]
fig,ax = plot_fourier(f,a,n)
fig.suptitle('f(x) = 0 (x >= -3 and x <= 1) else 10 ', fontsize=16)結果:

f = lambda x:np.abs(sin(x))
f = np.vectorize(f)
a = pi
n = [2,5,10]
fig,ax = plot_fourier(f,a,n)
fig.suptitle(' f(x) = |sin(x)| ', fontsize=16)
結果:

f = lambda x:np.abs(x)
f = np.vectorize(f)
a = 2
n = [1,5,10]
fig,ax = plot_fourier(f,a,n)
fig.suptitle('f(x) = |x|', fontsize=16)
ちなみにJupyter notebookで試すと以下のような警告メッセージがでます。でもちゃんと動いたので現場猫的にはヨシ
    """
    VisibleDeprecationWarning: Creating an ndarray from ragged nested sequences
    (which is a list-or-tuple of lists-or-tuples-or ndarrays with different lengths
     or shapes) is deprecated. If you meant to do this, you must specify
    'dtype=object' when creating the ndarray.
    """
今回使用したコード全体。
今回の話を皮切りにフーリエ変換、微・積分方程式の数値解析→アンテナ放射解析くらいまでに発展させることができればいいなぁと思います。
import matplotlib.pyplot as plt
import numpy as np
from numpy import sin,cos,tan,pi
from scipy import integrate

#a function
def fourier_expansion(fun,a,n):
    """
    fun:periodic function
    a:limit
    n:number of expansion
    """
    #tol = 1e-6
    x = np.linspace(-a,a,100)
    L = a


    a0 = 1/L/2 * integrate.quad(fun,-a,a)[0]
    an = 1/L * np.array([integrate.quad(lambda x:fun(x)*cos(i*x*pi/L),-L,L)[0] for i in np.arange(n)+1])
    bn = 1/L * np.array([integrate.quad(lambda x:fun(x)*sin(i*x*pi/L),-L,L)[0] for i in np.arange(n)+1])
    approx = a0 + np.array([an[i]*cos(pi*j*x/L) + bn[i]*sin(pi*j*x/L) for i,j in enumerate(np.arange(n)+1)]).sum(axis = 0)

    """
    c0 = 1/L/2 * integrate.quad(fun,-a,a)[0]

    cn = np.array([1/(L)*(integrate.quad(lambda x:fun(x)*cos(i*x*pi/L),-L,L)[0] - 1j* \
                            integrate.quad(lambda x:fun(x)*sin(i*x*pi/L),-L,L)[0]) \
                   for i in np.arange(n)+1 ])
    approx = c0 + np.array([cn[i]*np.exp(1j*pi*j*x/L) for i,j in enumerate(np.arange(n)+1) ]).sum(axis = 0)
    """
    return approx,[an,bn]


def plot_fourier(fun,a,n): #fun is already vectorized n is a list, e.g. [1,5,10].
    x = np.linspace(-a,a,100)
    fig,ax = plt.subplots()
    ax.plot(x,fun(x),label = 'exact')
    approx,cn = np.array([fourier_expansion(fun,a,i) for i in n]).T
    [ax.plot(x,j,'--', label = f'n = {n[i]}') for i,j in enumerate(approx)]
    [ax.set_xlabel('x'),ax.set_ylabel('f(x)')]
    ax.legend()
    return fig,ax

f = lambda x:0 if (x >= -5 and x <= 1) else 10 # else 1 if x >= 0 and x < 1
f = np.vectorize(f)
a = 3
n = [1,5,10]
fig,ax = plot_fourier(f,a,n)
fig.suptitle('f(x) = 0 (x >= -5 and x <= 0) else 10 ', fontsize=16)


f = lambda x:np.abs(sin(x))# else 1 if x >= 0 and x < 1
f = np.vectorize(f)
a = pi
n = [2,5,10]
fig,ax = plot_fourier(f,a,n)
fig.suptitle(' f(x) = |sin(x)| ', fontsize=16)

f = lambda x:np.abs(x)# else 1 if x >= 0 and x < 1
f = np.vectorize(f)
a = 2
n = [1,5,10]
fig,ax = plot_fourier(f,a,n)
fig.suptitle('f(x) = |x|', fontsize=16)


コメント